Difference between revisions of "BrainStreamExampleSpellerPart1"
Wiki-admin (talk | contribs) (→Part 1) |
Wiki-admin (talk | contribs) |
||
| (5 intermediate revisions by the same user not shown) | |||
| Line 10: | Line 10: | ||
Below, the experiment is shown in the [[BrainStreamBrainStreamEditor|BrainStream editor]]. | Below, the experiment is shown in the [[BrainStreamBrainStreamEditor|BrainStream editor]]. | ||
| − | [[File: | + | [[File:DocsSectionsExampleSpellerPart1_BS_editor.png|838px|471x]] |
''Figure 1: Visual speller in the BrainStream Editor'' | ''Figure 1: Visual speller in the BrainStream Editor'' | ||
As explained in the [[BrainStreamExampleSpellerIntro#SecExperiment|introduction]] to this example, the experiment consists of three parts: train, classify and test. In the Block files section of the BrainStream editor, you can see that a [[BrainStreamBuildingExperiments#SecBlock|block file]] has been created for each part of the experiment. In addition, there are two common block files which define settings that are applied to all blocks. In the Tables section, you can see that there is an [[BrainStreamBuildingExperiments#SecExpDef|experiment definition table]] for each of the blocks, and one common table that is used in all blocks. | As explained in the [[BrainStreamExampleSpellerIntro#SecExperiment|introduction]] to this example, the experiment consists of three parts: train, classify and test. In the Block files section of the BrainStream editor, you can see that a [[BrainStreamBuildingExperiments#SecBlock|block file]] has been created for each part of the experiment. In addition, there are two common block files which define settings that are applied to all blocks. In the Tables section, you can see that there is an [[BrainStreamBuildingExperiments#SecExpDef|experiment definition table]] for each of the blocks, and one common table that is used in all blocks. | ||
| + | |||
== Train block flowchart == | == Train block flowchart == | ||
Below, a flowchart of the Train block is shown: | Below, a flowchart of the Train block is shown: | ||
| − | [[File: | + | [[File:DocsSectionsExampleSpellerPart1_Flowchart.png|656px|261x]] |
''Figure 1: Flowchart'' | ''Figure 1: Flowchart'' | ||
| Line 31: | Line 32: | ||
A [[BrainStreamPlugIns|imported] table (StimDisplay in speller_common) is used to define all actions related to stimulus presentation. You can see the reference to this imported table in the 9th row of the main Actions table: '@speller_common.edt StimDisplay'. The imported table is shown below: | A [[BrainStreamPlugIns|imported] table (StimDisplay in speller_common) is used to define all actions related to stimulus presentation. You can see the reference to this imported table in the 9th row of the main Actions table: '@speller_common.edt StimDisplay'. The imported table is shown below: | ||
| − | [[File: | + | [[File:DocsSectionsExampleSpellerPart1_Speller_common_actions_2.png|832px|167x]] |
''Figure 2: StimDisplay imported table.'' | ''Figure 2: StimDisplay imported table.'' | ||
| Line 44: | Line 45: | ||
| stimSequence || several repetitions of highlighting all rows (1-3) and columns (4-6) || 231546 132654 312645 ... | | stimSequence || several repetitions of highlighting all rows (1-3) and columns (4-6) || 231546 132654 312645 ... | ||
|- | |- | ||
| − | | stimDict || <p>dictionary: translates stimulus numbers to grids with ones for <br />highlighted elements and zeros for non highlighted elements</p> || [[File: | + | | stimDict || <p>dictionary: translates stimulus numbers to grids with ones for <br />highlighted elements and zeros for non highlighted elements</p> || [[File:DocsSectionsExampleSpellerPart1_StimDict.png|225px|61x]] |
|- | |- | ||
| stimCode || current stimulus number || 3 | | stimCode || current stimulus number || 3 | ||
|- | |- | ||
| − | | curStim || <p>current stimulus grid (ones for highlighted elements and <br />zeros for non highlighted elements)</p> || [[File: | + | | curStim || <p>current stimulus grid (ones for highlighted elements and <br />zeros for non highlighted elements)</p> || [[File:DocsSectionsExampleSpellerPart1_CurStim.png|78px|66x]] |
|} | |} | ||
| Line 61: | Line 62: | ||
When the sequence is initialized, the epoch counter is increased by 1 and the speller grid is shown. Immediately afterwards, the highlightGrid function is executed. This function determines the number of the current stimulus (stimCode) and the corresponding grid (curStim), displays the correct image on the screen and inserts the marker highlightOn. After 0.05 seconds, the non-highlighted grid is shown. Another 0.05 seconds later, a decision is made whether to show another stimulus or end the sequence. | When the sequence is initialized, the epoch counter is increased by 1 and the speller grid is shown. Immediately afterwards, the highlightGrid function is executed. This function determines the number of the current stimulus (stimCode) and the corresponding grid (curStim), displays the correct image on the screen and inserts the marker highlightOn. After 0.05 seconds, the non-highlighted grid is shown. Another 0.05 seconds later, a decision is made whether to show another stimulus or end the sequence. | ||
| + | |||
== Data selection == | == Data selection == | ||
| − | As explained in the introduction, the visual speller is based on the brain response to the flashing rows and columns. Therefore, we need to collect a certain amount of data after each flash. The highlightGrid function (see the [[#StimPres|Stimulus presentation section]]), inserts a marker highlightOn each time a row or column of the grid is highlighted. As we need accurate synchronization with the data, this marker is inserted [[BrainStreamMarkerHandling#HardwareMarker|via the hardware]]. Data selection is specified for the highlightOn marker in the speller_common import-table. This is the import-tables' [[BrainStreamBuildingExperiments#SecDataSel|DataSelection table]: | + | As explained in the introduction, the visual speller is based on the brain response to the flashing rows and columns. Therefore, we need to collect a certain amount of data after each flash. The highlightGrid function (see the [[#StimPres|Stimulus presentation section]]), inserts a marker highlightOn each time a row or column of the grid is highlighted. As we need accurate synchronization with the data, this marker is inserted [[BrainStreamMarkerHandling#HardwareMarker|via the hardware]]. Data selection is specified for the highlightOn marker in the speller_common import-table. This is the import-tables' [[BrainStreamBuildingExperiments#SecDataSel|DataSelection table]]: |
| − | [[File: | + | [[File:DocsSectionsExampleSpellerPart1_Speller_common_data.png|456px|53x]] |
''Figure 4: DataSelection table'' | ''Figure 4: DataSelection table'' | ||
| Line 76: | Line 78: | ||
Each time a row or column of the grid was highlighted, the highlightOn marker was inserted. Thus, in the log file we can look up what the time between two successive highlightOn markers was. These are the first three highlightOn markers: | Each time a row or column of the grid was highlighted, the highlightOn marker was inserted. Thus, in the log file we can look up what the time between two successive highlightOn markers was. These are the first three highlightOn markers: | ||
| − | <pre>18Nov11|14:39:43.559 INFO > | + | <pre>18Nov11|14:39:43.559 INFO > ***** ( highlightOn) ************************************************************* |
18Nov11|14:39:43.559 INFO > 17.10 (eeg:#2972.00) 17.10 17.29 act: getvar (t=EVENT) highlightOn | 18Nov11|14:39:43.559 INFO > 17.10 (eeg:#2972.00) 17.10 17.29 act: getvar (t=EVENT) highlightOn | ||
. | . | ||
. | . | ||
| − | 18Nov11|14:39:43.682 INFO > | + | 18Nov11|14:39:43.682 INFO > ***** ( highlightOn) ************************************************************* |
18Nov11|14:39:43.683 INFO > 17.23 (eeg:#3007.00) 17.23 17.42 act: getvar (t=EVENT) highlightOn | 18Nov11|14:39:43.683 INFO > 17.23 (eeg:#3007.00) 17.23 17.42 act: getvar (t=EVENT) highlightOn | ||
. | . | ||
. | . | ||
| − | 18Nov11|14:39:43.897 INFO > | + | 18Nov11|14:39:43.897 INFO > ***** ( highlightOn) ************************************************************* |
18Nov11|14:39:43.897 INFO > 17.36 (eeg:#3039.00) 17.36 17.63 act: getvar (t=EVENT) highlightOn | 18Nov11|14:39:43.897 INFO > 17.36 (eeg:#3039.00) 17.36 17.63 act: getvar (t=EVENT) highlightOn | ||
</pre> | </pre> | ||
| Line 91: | Line 93: | ||
These are the last three highlightOn markers: | These are the last three highlightOn markers: | ||
| − | <pre>18Nov11|14:40:25.825 INFO > | + | <pre>18Nov11|14:40:25.825 INFO > ***** ( highlightOn) ************************************************************* |
18Nov11|14:40:25.825 INFO > 58.80 (eeg:#13647.00) 58.80 59.56 act: getvar (t=EVENT) highlightOn | 18Nov11|14:40:25.825 INFO > 58.80 (eeg:#13647.00) 58.80 59.56 act: getvar (t=EVENT) highlightOn | ||
. | . | ||
. | . | ||
| − | 18Nov11|14:40:25.835 INFO > | + | 18Nov11|14:40:25.835 INFO > ***** ( highlightOn) ************************************************************* |
18Nov11|14:40:25.835 INFO > 58.96 (eeg:#13688.00) 58.96 59.57 act: getvar (t=EVENT) highlightOn | 18Nov11|14:40:25.835 INFO > 58.96 (eeg:#13688.00) 58.96 59.57 act: getvar (t=EVENT) highlightOn | ||
. | . | ||
. | . | ||
| − | 18Nov11|14:40:25.844 INFO > | + | 18Nov11|14:40:25.844 INFO > ***** ( highlightOn) ************************************************************* |
18Nov11|14:40:25.845 INFO > 59.12 (eeg:#13730.00) 59.12 59.58 act: getvar (t=EVENT) highlightOn </pre> | 18Nov11|14:40:25.845 INFO > 59.12 (eeg:#13730.00) 59.12 59.58 act: getvar (t=EVENT) highlightOn </pre> | ||
Latest revision as of 15:05, 26 September 2018
Example 2: Visual Speller
Part 1
<- Go back to the introduction - Continue with Part 2 ->
This example can be found in the folder brainstream/examples/blocks/visual_speller1.
Experiment overview
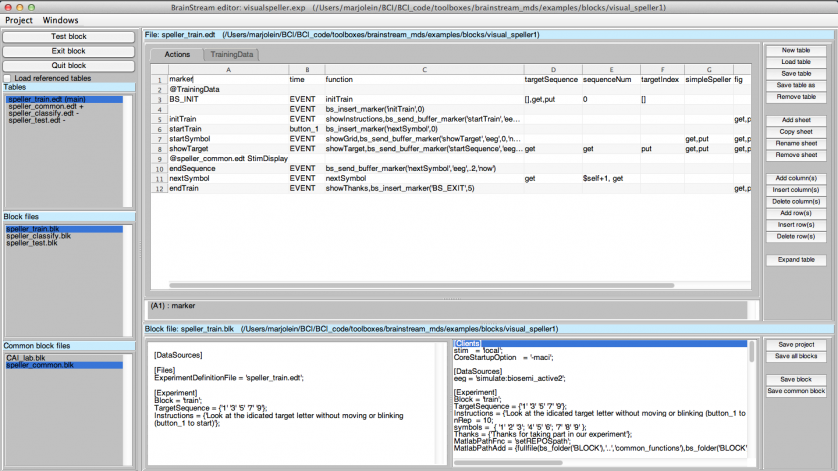
Below, the experiment is shown in the BrainStream editor.
Figure 1: Visual speller in the BrainStream Editor
As explained in the introduction to this example, the experiment consists of three parts: train, classify and test. In the Block files section of the BrainStream editor, you can see that a block file has been created for each part of the experiment. In addition, there are two common block files which define settings that are applied to all blocks. In the Tables section, you can see that there is an experiment definition table for each of the blocks, and one common table that is used in all blocks.
Train block flowchart
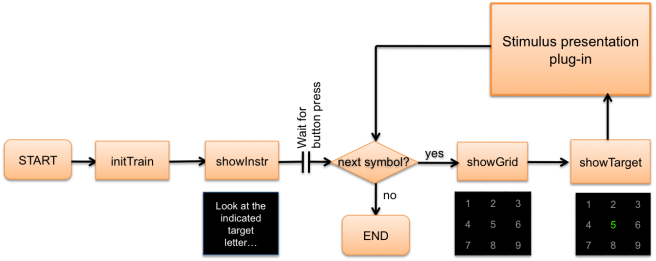
Below, a flowchart of the Train block is shown:
Figure 1: Flowchart
At the beginning of the experiment, variables are initialized and instructions are shown to the subject. Subjects can start the experiment by pressing a button. The function nextSymbol decides whether a new stimulus sequence should be presented. If this is the case, the target character for this sequence is indicated in green. As you can see, the presentation of stimuli is managed by a imported table (see the stimulus presentation section below for more details). The experiment ends when all sequences have been presented.
Stimulus presentation
A [[BrainStreamPlugIns|imported] table (StimDisplay in speller_common) is used to define all actions related to stimulus presentation. You can see the reference to this imported table in the 9th row of the main Actions table: '@speller_common.edt StimDisplay'. The imported table is shown below:
Figure 2: StimDisplay imported table.
A number of user defined variables play a role in stimulus presentation. The table below gives an overview of these variables:
Below, the flowchart for stimulus presentation is shown:
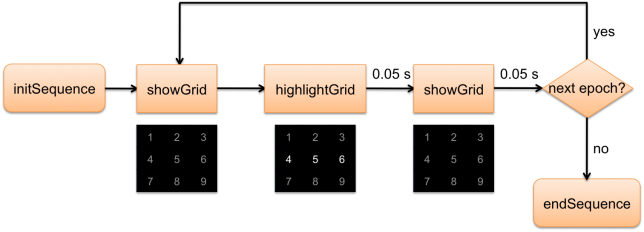
Figure 3: Flowchart for stimulus presentation
Stimulus presentation begins with the modification of a number of variables: the epoch counter is set to 0, and the variables stimCode and curStim are initialized. Then the user defined function initSequence is executed. This function creates a stimulus sequence and a stimulus dictionary. Creating a stimulus sequence at the beginning of a sequence has the disadvantage that the stimulus sequence cannot be adapted during the experiment. However, in some cases you might want to intensify certain rows or columns more often than others. In the next section, we will adapt the visual speller to make this possible.
When the sequence is initialized, the epoch counter is increased by 1 and the speller grid is shown. Immediately afterwards, the highlightGrid function is executed. This function determines the number of the current stimulus (stimCode) and the corresponding grid (curStim), displays the correct image on the screen and inserts the marker highlightOn. After 0.05 seconds, the non-highlighted grid is shown. Another 0.05 seconds later, a decision is made whether to show another stimulus or end the sequence.
Data selection
As explained in the introduction, the visual speller is based on the brain response to the flashing rows and columns. Therefore, we need to collect a certain amount of data after each flash. The highlightGrid function (see the Stimulus presentation section), inserts a marker highlightOn each time a row or column of the grid is highlighted. As we need accurate synchronization with the data, this marker is inserted via the hardware. Data selection is specified for the highlightOn marker in the speller_common import-table. This is the import-tables' DataSelection table:
Figure 4: DataSelection table
Thus, every time a row or column of the speller matrix is highlighted, 0.6 seconds of EEG data will be selected, starting at stimulus onset.
Evaluation of the speller
According to the flowchart in figure 3, the time between two successive flashes should be 100 ms. However, due to BrainStream processing, the time between stimuli is probably longer. In the [[BrainStreamLogFile|log file], we can find what the exact time between stimuli was.
Each time a row or column of the grid was highlighted, the highlightOn marker was inserted. Thus, in the log file we can look up what the time between two successive highlightOn markers was. These are the first three highlightOn markers:
18Nov11|14:39:43.559 INFO >	***** (              highlightOn) *************************************************************
18Nov11|14:39:43.559 INFO >	 17.10 (eeg:#2972.00)    17.10    17.29	act: getvar	(t=EVENT)	highlightOn
	.
	.
18Nov11|14:39:43.682 INFO >	***** (              highlightOn) *************************************************************
18Nov11|14:39:43.683 INFO >	 17.23 (eeg:#3007.00)    17.23    17.42	act: getvar	(t=EVENT)	highlightOn
	.
	.
18Nov11|14:39:43.897 INFO >	***** (              highlightOn) *************************************************************
18Nov11|14:39:43.897 INFO >	 17.36 (eeg:#3039.00)    17.36    17.63	act: getvar	(t=EVENT)	highlightOn
The first number after the date and timestamp indicates the time of marker arrival. In this case, the first highlightOn marker arrived at time 17.10, the second marker at 17.23 and the third at 17.36. Thus, in the beginning of the experiment, the time between two consecutive stimuli is 130 ms, which is 30 ms longer than specified in the Actions table.
These are the last three highlightOn markers:
18Nov11|14:40:25.825 INFO >	***** (              highlightOn) *************************************************************
18Nov11|14:40:25.825 INFO >	 58.80 (eeg:#13647.00)    58.80    59.56	act: getvar	(t=EVENT)	highlightOn
	.
	.
18Nov11|14:40:25.835 INFO >	***** (              highlightOn) *************************************************************
18Nov11|14:40:25.835 INFO >	 58.96 (eeg:#13688.00)    58.96    59.57	act: getvar	(t=EVENT)	highlightOn
	.
	.
18Nov11|14:40:25.844 INFO >	***** (              highlightOn) *************************************************************
18Nov11|14:40:25.845 INFO >	 59.12 (eeg:#13730.00)    59.12    59.58	act: getvar	(t=EVENT)	highlightOn
The last three highlightOn markers of the experiment arrive at time 58.80, 58.96 and 59.12, respectively. Thus, towards the end of the experiment, the time between two consecutive stimuli has increased to 160 ms. This is an increase of 30 ms compared to the beginning of the experiment. For ERP experiments, this is not good.
Thus, there are two problems with stimulus timing in the current speller implementation. In the first place, the timing between two stimuli cannot be specified accurately in the experiment definition tables. Secondly, the timing between stimuli is not stable throughout the experiment. These aspects of the speller need to be improved.


