BrainStreamExampleSpellerPart2
Example 2: Visual speller
Part 2
< - Go back to Part 1 - Continue with Part 3 ->
In the previous part of the visual speller example, we saw that stimulus sequences were constructed at the beginning of each sequence. This has the disadvantage that the stimulus sequence cannot be adapted during the experiment. However, in some cases you might want to intensify certain rows or columns more often than others. For example, during the sequence you could determine which row and column are most likely to contain the target character, and then intensify this row and column more often than others. In addition, we will show how markers sent out at stimulus presentation can not only synchronize stimulus moments with the data, but also update global variables and trigger data selection.
Adaptations to stimulus presentation
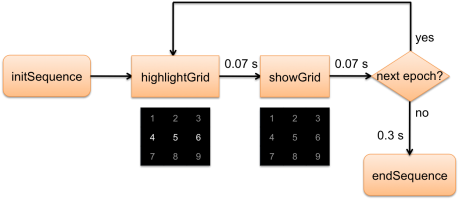
In order to achieve the possibility of dynamic stimulus presentation, we must make a number of changes to the stimulus presentation import-table (it is located in the StimDisplay sheet of the speller_common table). Below, the new import-tables' flowchart is shown:
Figure 1: New stimulus presentation flowchart
In addition, changes have been made to the initSequence and highlightGrid functions. Whereas the initSequence function previously created both a stimulus dictionary and a stimulus sequence, it now creates a dictionary only. Subsequently, the highlightGrid function determines which stimulus should be presented. Previously, it looked at the epoch counter and the stimulus sequence to find the current stimulus. However, the function has been adapted so that it now flashes a random row or column, with the exception that the row or column that was stimulated last cannot be intensified again.
In this example, we present random stimuli. However, the choice of stimulus could also depend on other information, such as the probability that the row or column contains the target character. This adaptation makes the stimulus presentation much more flexible.
Actions associated with the stim_# markers
In the highlightGrid function, a hardware marker stim_# (where # is a number) is sent each time a row or column is highlighted. These markers have several functions:
- mark the data with the occurrence of stimuli
- trigger data selection
- set the stimCode variable to the value of the current stimulus
The first function of the markers is to specify in the data stream at which moments in time stimuli occurred. This is important if you want to do offline analyses on the recorded data after the experiment is finished. Remember that only hardware markers are saved in the raw data file.
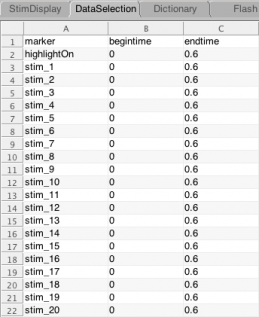
The second function of the markers is to let BrainStream select data each time a stimulus is presented. This action is specified on the DataSelection sheet of the speller_common table (see figure below). After each stimulus, 600 ms of data is selected from the data source.
Figure 2: DataSelection table (in speller_common)
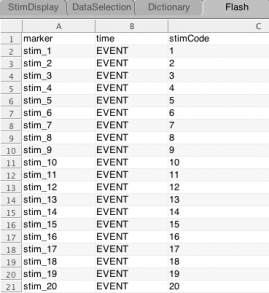
Finally, whenever a stim_# marker arrives, it sets the global variable stimCode to the value of the current stimulus. This action is specified on the Flash sheet of the speller_common table (see figure below). Subsequently, the value of stimCode is used by the updateCodeBook function to store the stimulus sequence. In addition, the stimCode value will be used in the next call to the highlightGrid function to prevent the same row or column being flashed twice in a row.
Figure 3: Flash table (in speller_common)
This example illustrates the range of actions that can be triggered by one single marker.
Adaptations for speller evaluation
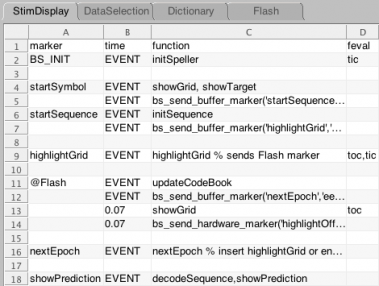
An extra column, feval, has been added to the stimulus presentation import-table:
Figure 4: StimDisplay table (in speller_common)
In this column, Matlab's tic and toc functions are specified. This allows us to check the timing of stimulus presentation. The first tic/toc combination measures the time between speller startup (BS_INIT) and the first stimulus (highlightGrid). After that, timing is started immediately after each stimulus onset. The first toc, at showGrid, measures the duration of the stimulus and the second toc, at highlightGrid, measures the time until the next stimulus (also called stimulus onset asynchrony, or SOA). Remember that functions in the feval column are executed after functions in the function column.
Evaluation of the speller
As a result of the tic and toc functions, we can see the duration of stimuli and epochs directly in the command window. These are the durations of 6 stimuli from the last sequence:
| stimulus duration | epoch duration (SOA) |
| 0.103200 | 0.173343 |
| 0.105327 | 0.176076 |
| 0.105552 | 0.178371 |
| 0.091815 | 0.175831 |
| 0.096863 | 0.175619 |
| 0.095632 | 0.171901 |
As in the previous example, the duration of stimuli and epochs is longer than we intended. In the import-table, the time between stimulus onset (highlightGrid) and stimulus offset (showGrid) is specified as 0.07 seconds. From the table above, we can see that the actual stimulus duration is around 100 ms. The time between stimulus onset and the next stimulus decision (nextEpoch) should be 0.14 seconds, but turns out to be approximately 30 ms longer. Moreover, the duration of stimuli is not stable: in this small group of six stimuli, the difference in duration between the longest and the shortest stimulus is 14 ms.


