Difference between revisions of "BrainStreamExampleSpellerPart4"
Wiki-admin (talk | contribs) (Created page with "= Example 2: Visual speller = __TOC__ = Part 4 = <- Go back to Part 3 - Continue with Part 5 -> I...") |
Wiki-admin (talk | contribs) |
||
| Line 9: | Line 9: | ||
The loop function runSequence executes most actions of the stimulus presentation import-table. The new flowchart of the imported table looks like this: | The loop function runSequence executes most actions of the stimulus presentation import-table. The new flowchart of the imported table looks like this: | ||
| − | [[File: | + | [[File:DocsSectionsExampleSpellerPart4_Flowchart2.png|767px|435x]] |
''Figure 1: Stimulus presentation import-table flowchart. Actions indicated in orange are executed at the BrainStream Matlab session, whereas actions indicated in blue are executed at the client.'' | ''Figure 1: Stimulus presentation import-table flowchart. Actions indicated in orange are executed at the BrainStream Matlab session, whereas actions indicated in blue are executed at the client.'' | ||
Latest revision as of 14:26, 4 October 2018
Example 2: Visual speller
Part 4
<- Go back to Part 3 - Continue with Part 5 ->
In previous parts of the experiment, stimulus presentation timing was not accurate. Epochs occurred later than specified and the time between stimuli was not constant throughout a sequence. In this part of the example, we will improve these timing issues by using a simple loop function for stimulus presentation.
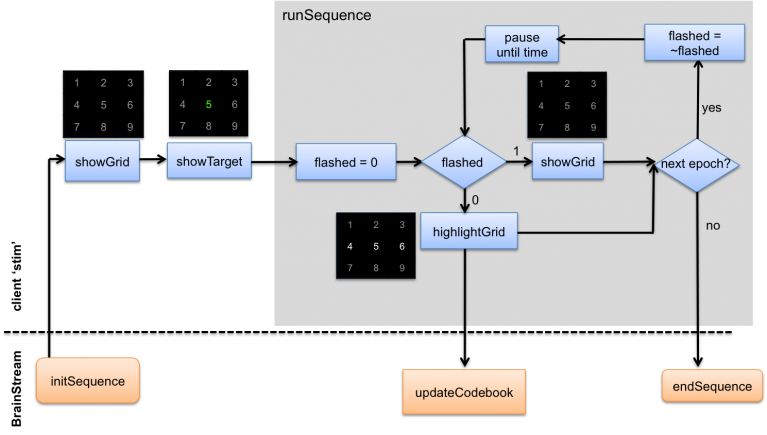
The loop function runSequence executes most actions of the stimulus presentation import-table. The new flowchart of the imported table looks like this:
Figure 1: Stimulus presentation import-table flowchart. Actions indicated in orange are executed at the BrainStream Matlab session, whereas actions indicated in blue are executed at the client.
This is the runSequence function:
function ev = runSequence(ev)

isi = 0.2; % inter-stimulus-interval
flashed = 0;
count = 0;
tic;
while 1
    toc
    if ~flashed
        % randomly highlight row or column and send stim_## marker
        ev = highlightGrid(ev);
        ev = bs_send_hardware_marker(ev,sprintf('stim_%d',ev.stimCode),'eeg'); % mark the data with what happened
    else
        % dim higlighted row or column
        ev = showGrid(ev);
        ev = bs_send_hardware_marker(ev,'highlightOff','eeg'); % also mark this moment
    end
    count = count + 1;
    if count >= 2*bs_get_blockvalue(ev,'Experiment','nRep',10)
        ev = bs_send_buffer_marker(ev,'endSequence','eeg',.3); % N.B. enough extra for ERP to finish...
        break
    end
    flashed = ~flashed;
    pause(max(0, count*(isi/2)-toc));
end
end
This loop function should make sure that the time between two stimuli is always 200 ms, during which period a row or column is flashed for 100 ms and the non-highlighted grid is shown for the next 100 ms. Matlab's tic, toc and pause functions are used for stimulus timing.
Evaluation
As a result of the tic and toc commands in the runSequence function, we can see in the client's command window at which timepoints stimuli have been turned on and off. These are the results of the first and last three stimuli of the last sequence:
| stimulus | highlight on | highlight off |
| 1 | 0.000007 | 0.099184 |
| 2 | 0.199446 | 0.299849 |
| 3 | 0.399729 | 0.499392 |
| ... | ... | ... |
| 18 | 3.399827 | 3.499717 |
| 19 | 3.599168 | 3.699124 |
| 20 | 3.799698 | 3.899841 |
Thus, rows and columns are highlighted and dimmed precisely every 100 ms. Stimulus duration and inter stimulus interval are stable throughout the sequence. In conclusion, using loop functions for presenting sequences of stimuli allows for a much better timing of your stimuli.
A downside of the loop function which we used here is that the loop cannot be interrupted by BrainStream. All stimuli must be presented before the function is finished and BrainStream processing can continue. In the final part of this example we will show how to create a [[BrainStreamLoopTick|looptick] function to improve this situation.
